• Login
    • Register

Living Room Real EstateLiving Room Real Estate

Denver Residential Real Estate

  • Menu
  • About Living Room
  • Buy
  • Sell
  • Blog
  • ADUs
  • Giving Back
  • Contact Us

How has COVID19 Affected the Denver Real Estate Market?

Nine months into the Covid-19 pandemic, we have collected some data and feel ready to talk about how this pandemic has impacted the Denver real estate market. Since staying home has become a new way of life, it is logical that the demand for housing has hit an all-time high.

Covid Deals

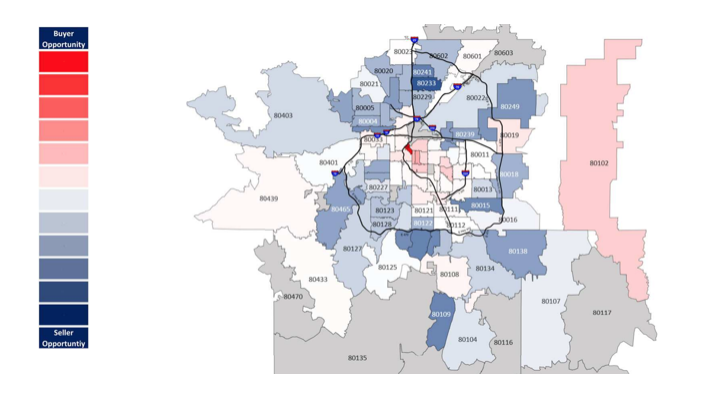
At the onset of the pandemic, there was a slight opportunity to find a good deal for three months. Those who were willing to purchase amid uncertainty were rewarded (see price decreases below in light blue April, May, and June).

On April 11th the Colorado Real Estate Division banned in-person home showings until May 1st. Offers were being made without seeing properties, inspectors went in and emailed reports and closing happened in parking lots.

Demand for Homes

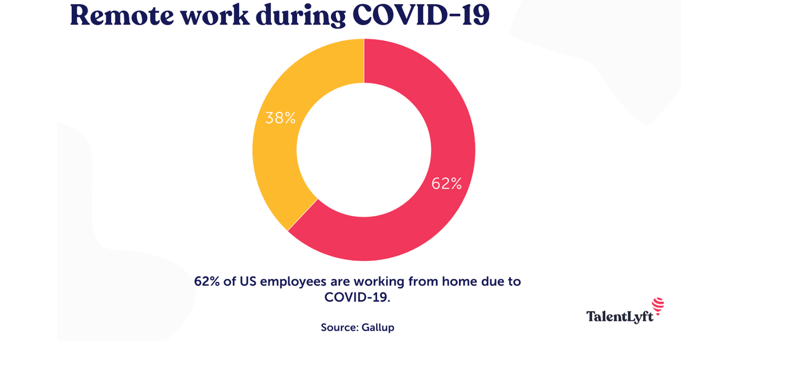
Why would anyone buy under such conditions? Well, at this point everyone needed an extra 1000 sf. Not only were they working from home but they also had kids homeschooling, needed a place for their new Peloton bike, and no escape (aka vacation) insight. Only around 7% of U.S. employees regularly worked from home before the COVID-19. 62% of US employees are working from home now.

Remote Workers with Expendable Income

The demand for extra space has become a priority for many at the same time people actually experienced increased savings. In addition to receiving stimulus money, many saw their monthly bills decrease. Savings were achieved in many categories including commuting, travel, restaurant/bars, entertainment, fitness, personal services, etc. We actually saw personal saving rates increase in April 2020.

Boom in Refinancing

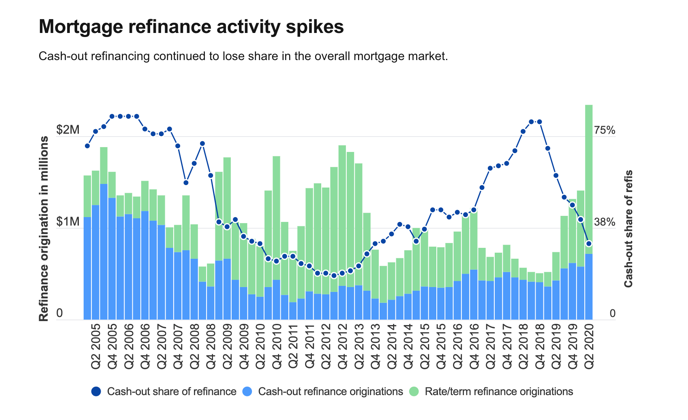
At the same time, most homeowners were able to refinance at a lower interest rate and decrease their monthly housing costs. With interest rates hovering at historic lows of around 3 percent for a 30-year fixed-rate loan, refinance mortgages originated in the second quarter of 2020 represented an estimated $513 billion in total dollar volume. That number was up 130 percent from a year ago, to the highest point in almost 17 years.


We expect total mortgage originations to reach $1.1 trillion in Q3 2020 and $3.6 trillion for the full year 2020. For Q3 2020, refinance originations to be $670 billion.

Lowest Interest Rates
in History

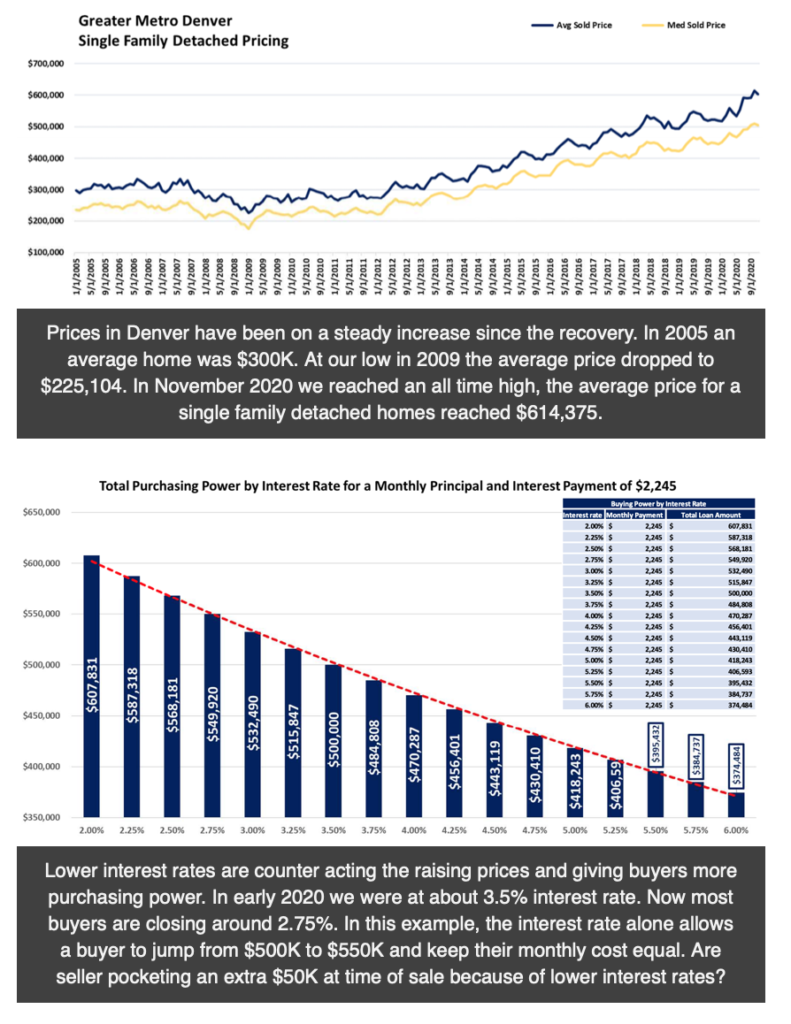
CPR says that 9 in 10 people in Colorado were employed in July 2020. Those people were working from home, had a boost in savings, and were looking to take advantage of low-interest rates. Lower interest rates counterbalance a higher list price and make their monthly payment manageable. I looked back at Mortgage Rates and home values from Zillow and did some quick monthly payment calculations assuming 20% down.


Oct 2016 / 3.42% / $377K = $1636/m

Oct 2017 / 3.85% / $409K = $1850/m

Oct 2018 / 4.9% / $446K = $2226/m

Oct 2019 / 3.65% / $449K = $1975/m

Oct 2020 / 2.88% / $469K = $1900/m

With the lower rates, home prices started to increase again in July. As prices started to soar buyers were unphased. The list price is irrelevant to buyers because they are focused on the cost of their monthly payment.


Competition Pushed
Up Prices

Demand has been strong and inventory has lagged behind. Active inventory between September 2019 to September 2020 is down 42.91% according to DMAR. The low inventory resulted in bidding wars. There aren’t widely available stats so we counted up the number of offers we received on each listing and the number of offers each buyer wrote to get their offer accepted based on Living Room’s transactions. As a whole, it took 2.5 offers per sale within our brokerage since Covid started. It was our experience that single-family homes were more competitive and required closer to 3.5 offers per sale while condo and townhomes were closer to 1.4 offers.

Double the Work

Naturally, it follows that real estate agents were busier than ever during Covid. We are writing 2.5 offers per client and that doesn’t take into effect the number of showings required. In addition, lenders were extremely busy with refinances in addition to new purchases. Lastly, the title companies doubled their workload – instead of one closing with the buyers and sellers, they had to do two separate closings – one for the buyers and one for the sellers. It was double the work all around and we did it in masks.

Low Inventory and
Off-Market Deals

In the graph below you can see the dotted blue line where we expected inventory to be this year before Covid changed the scenario. The solid blue shows our actual inventory. It is shocking to see more homes pending and closed than active inventory.


How is that possible? Answer – many homes sold without ever being listed on the market. The sales were recorded by brokers after the fact. Within our brokerage it happened – friends selling homes to friends, renters buying from their landlord, or buyers placing offers on off-market properties.

Prices Going Up

The high demand for homes in Denver and low inventory is pushing prices up. Since last year, prices in Denver are up 6.4% according to Zillow and predicted to keep going up. Costs are also increasing for building – lumber is a major factor but throughout the supply chain prices are increasing across the board.

People on the Move
During Covid

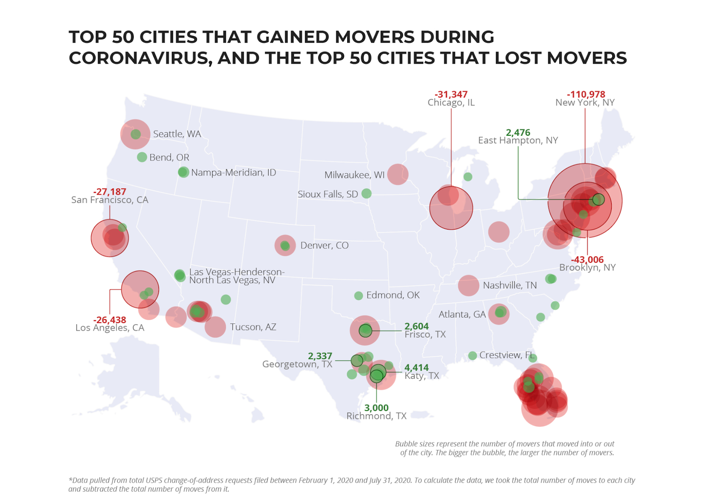
Covid created major change and the change resulted in many moves. According to the Postal Service’s Change of Address requests, over 15.9 million people have moved during the coronavirus. The national trend was a move from cities to the suburbs or smaller towns. Many Denver residents looking for more space left the city. At the same time, Denver has witnessed an influx of new residents from bigger cities. Working remotely has given people the ability to live anywhere and people want to live in Denver. Our city is more open than other cities and we’ve been lucky to not be the center of a major


It’s important to note that the net losses experienced by big cities eclipsed the net gains experienced by the smaller cities. Residents relocating from big cities spread out to smaller areas across the country. A Denver Post opinion piecesaid, “A new wave of urban migrants may be crashing into the suburban and rural West. You could even call them COVID migrants.” People living in Denver are moving to more affordable “Zoom towns” in rural areas. The rural real estate market nationwide has taken off much faster than in urban areas.


You can see in the graph above that Highlands Ranch, Broomfield, Thornton, Parker, and Evergreen are very in-demand areas while the city center is actually a buyer’s market. People need and want more space. Walkability and the length of commutes is less relevant.

What now?

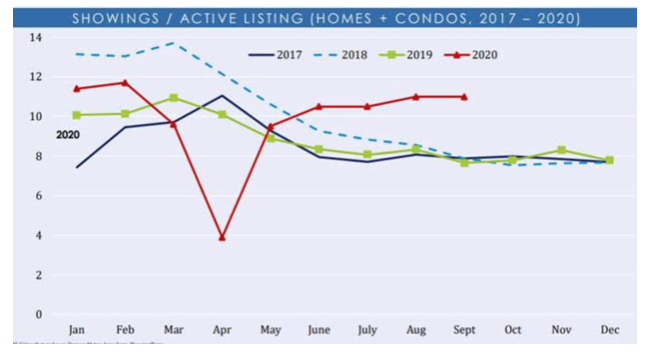
Typically this time of year is when demand starts to decrease. However, the showings stats below demonstrate that showings have consistently increased month over month since the big dip in April 2020. Masks and other precautions are being taken, but buyers are on a mission to get into a home. The election and holiday will slow down buyers, but we expect a robust 2021.

Conclusion

It was hard to predict how the pandemic would affect the real estate market in Denver early on. Now that some time has passed, we see that stay-at-home orders, low-interest rates, and movement has created a huge boost in demand and therefore prices. Sellers are experiencing the tangible benefits of these price increases when they go to sell, while buyers are battling it out in multiple offer situations. Those lucky enough to win in a bidding war are saved by low-interest rates that make their monthly payment manageable. If Denver can weather the recession of the 2020 pandemic, I’m optimistic about the years to come.

Posted in: Blog, Housing Market Update

Tips to find listings online

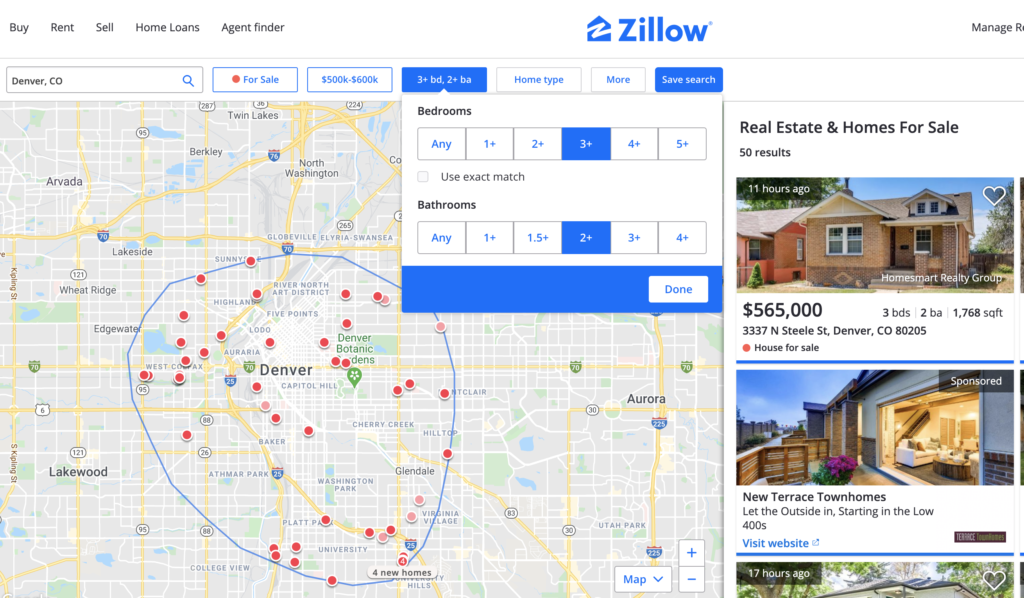
Looking for listings online? Every time a real estate agent adds a listing to the multiple listing service (MLS) it gets published to thousands of websites for consumers. The same information appears everywhere, it’s just a matter of choosing which app/website you prefer and pairing that technology with your favorite real estate agent to help you through the buying process. My philosophy is to work with each client on the platform they prefer most.

Every real estate website has the same basic listing information. They compete for users by trying to offer better features than other websites/apps. Almost all websites/apps are free to use for consumers. They typically make money when they connect you with an agent. Agents listed on Zillow are typically paying over $3000/m to be advertised in a zip code and connect with new buyers who request a showing through the service. Redfin also wants you to use their discount agents so they will give you a feature to schedule a showing with their agents. We believe hiring an agent should be based on their abilities and experience – not a random connection fueled by advertising dollars.

You should use the best agent and the best technology to find your next home. You can just as easily share the listing you like on Zillow with your preferred real estate agent and schedule a time with them to meet you at the property. They will be someone you trust and can help you beyond just showing a home to make sure you have an exceptional home buying experience.

There are thousands of real estate websites that advertise listings including www.LivingRoomDenver.com. However, because we are a small, locally owned company we have not been able to invest millions of dollars into our website to add features in the same way that Zillow.com has over the last 15 years. Below we’ve shared three of the most user-friendly websites/apps where consumers can find listings online.

Zillow 
Zillow holds the biggest market share of any real estate website capturing 29.2% of the market and also owns the second most visited website Trulia.com. They get approximately 59 million unique visitors per month! Zillow launched in 2006 was a game-changer for the industry. For the first time, consumers without an agent could sit at home and browse houses all around the city (and in other cities and states).

Pros:
1. Google maps/street view linked in the third and fourth images in the photo scroll. Street view can put you in front of a home in seconds to evaluate if you like the “feel” of an area.

2. See how many times the property has been viewed and how many people have saved it. This helps you evaluate the popularity of a listing.

3. Tag what they like about properties. For example “price” or “kitchen”. The app/website uses your votes to push you listings it thinks you will like based on past votes. It makes it simple to view list of homes you favorite during your search.
.
4. Reviews – Zillow is a good place to check reviews about your agent. See my reviews here.

5. Zillow walkthrough + 3D tours for tours from your couch.

6. See listing history,

7. Easy to send links to your agent and friends.

8. Most extensive rental listings for privately held homes

Cons:
1. Open Houses not accurate
2. Slow to update new listings and under contract,
3. Agents advertising
4. Always double check your Zestimate with a professional real estate agent. Zillow does not have the ability to analyze the finish level of your interior which can account for major price adjustments.

Redfin


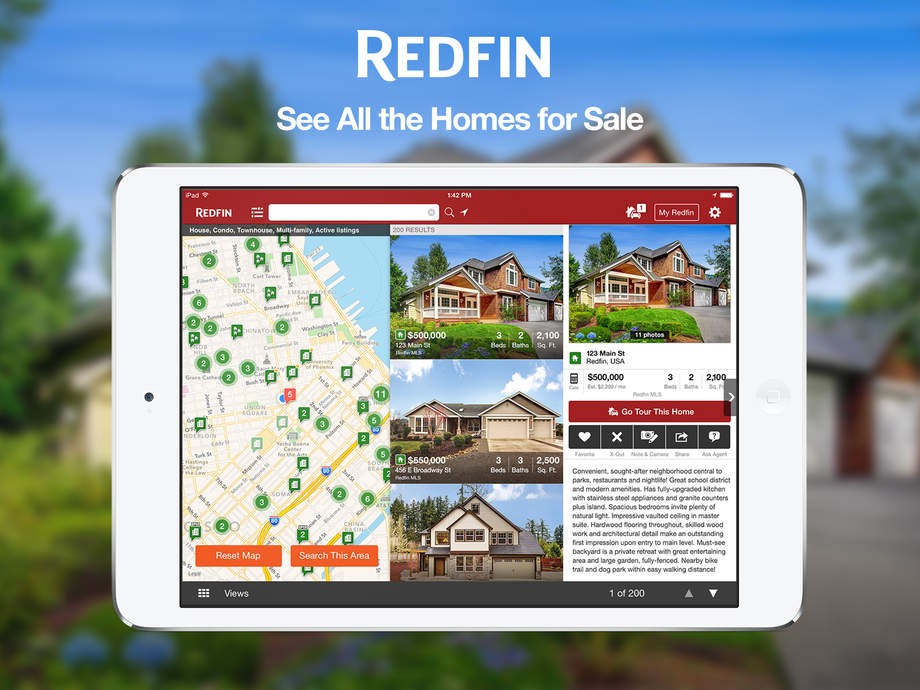
Unlike Zillow and Realtor.com, Redfin is an actual brokerage who pays its agents a base salary and makes money when users buy or sell homes with its real estate agents. They offer a 1% listing fee if you also buy a home with them. At Living Room Real Estate, our listing commission is always negotiable and if you are listing and also buying a house we can be very competitive with Redfin plus offer personalized service with a dedicated agent on your side.

Features about Redfin we like:
1. It updates the quickest from the MLS. Way faster than Zillow!

2. Shows the exact bathroom count. MLS shows 2 baths when there are actually only 1.5 which is a huge difference.

3. Shows properties that are getting more traffic as a “hot home” which helps me know that those listings will get multiple offers.

4. Has an icon on the first pic in the listing to let me know if there is a 3D walkthrough available.

5. Allows you to X out listings you don’t like.

6. Has a feed that shows me new listings and price changes since the last time I opened the app.

7. Really good open house functionality, not as relevant right now.

8. It has a great mortgage calculator and a commute calculator feature.

What I don’t like:
1. Once a listing is sold the photos go away.
2. Redfin agents are discount service providers who do higher volume. They may not give you the dedicated one on one attention that we provide to buyers through the home buying process.


Agent’s Choice – HomeSnap

HomeSnap is likely your agent’s favorite app because they offer rich features for your agent to do business. You might have a better experience sharing listing from HomeSnap with your agent because from their phone they can access extremely valuable information that one other app offers professionals.

Pros for Buyers:
1. Stand in front of any home and snap a photo. The app will recognize your location and give you all the information about the home available even if it is not for sale.
2. Communicate directly with your agent in this app. Make sure your notifications are on so you can see messages.

Pros for Agents:
1. Each listing has private information that is only shared with other real estate professionals that do not show up on Zillow for example. Your agent can see private remarks which typically have information about when offers are due and showing instructions.

2. An agent can quickly research the listing agent with easy access to their contact info, office info, past deals analysis. Your buyer’s agent can evaluate their level of experience of the listing agent which will help you in negations.

3. From their phone, agents can quickly create a comparative market analysis report for any home with a simple workflow and email it to you as PDF documents.

4. We can schedule a showing with the seller directly through this app – not an option on any other platform.

5. Agents can use Homesnap Pro is see important data about an entire neighborhood including Likelihood to List, Distressed, Ownership Type, Home Equity, and Loan Balance.

Cons

1. This app is built for agents and caters to their needs. It is not widely used by consumers and is not super user friendly.


Posted in: Blog, Housing Market Update, Uncategorized

Denver Real Estate Stats: What you should know!

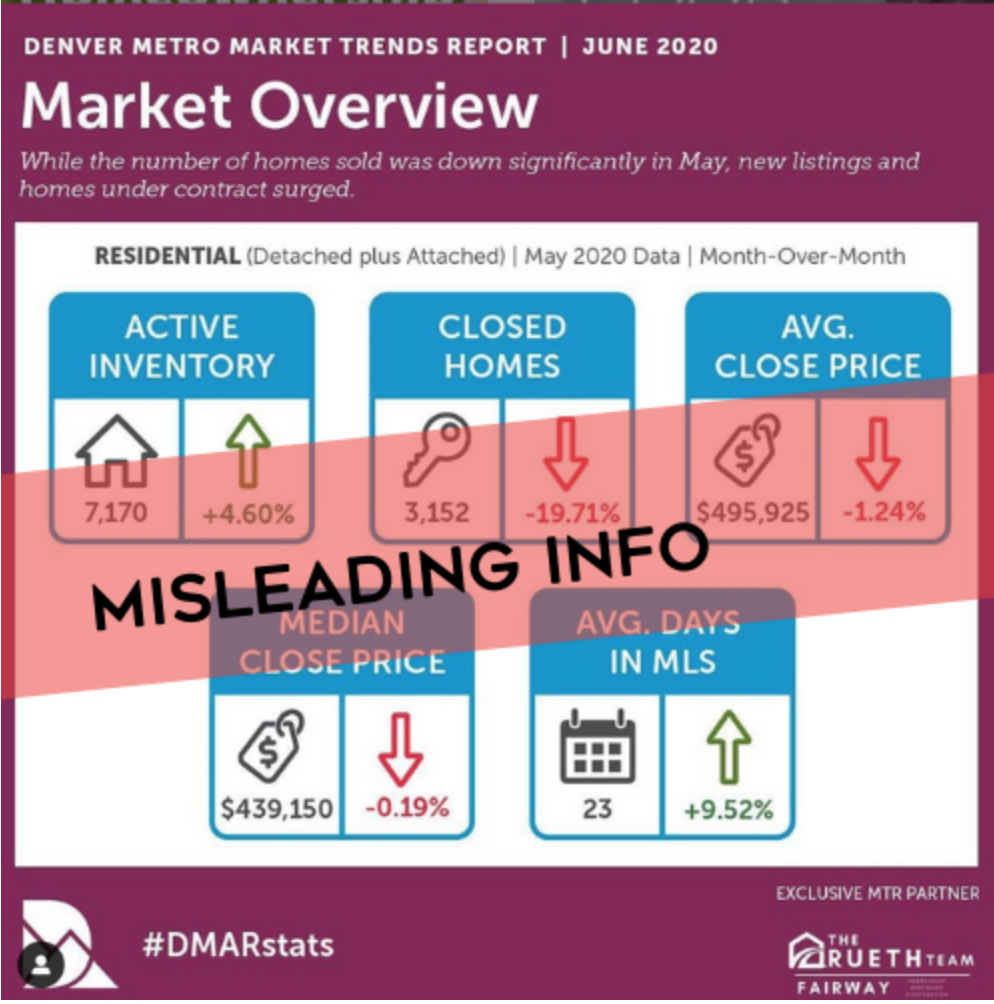
Some information can be misleading. Take this post shared Thursday, June 4th by a very credible organization, the Denver Board of Real Estate Agents. They call this information the “June 2020 Market Overview” but it is important to understand that the data is based on homes closed in May 2020. You may or may not know that once you find a home you love and put in an offer, you are typically “under contract” on that property for at least 30 days giving you a due diligence period before you close. So the homes that closed in May 2020 were put under contract in April 2020. On March 23rd Coloradoan’s were ordered to “stay at home” and by April 8th, all in-person showings were shut down. Real Estate agents adopted virtual showing strategies, but showings did not resume until the beginning of May. So now you know that June 2020 stats should really be labeled April 2020 stats. Now that you understand that our stats are a lagging indicator, you can understand how the graphic actually shows what happened to the Denver real estate market during the “Stay at Home” order in Denver.

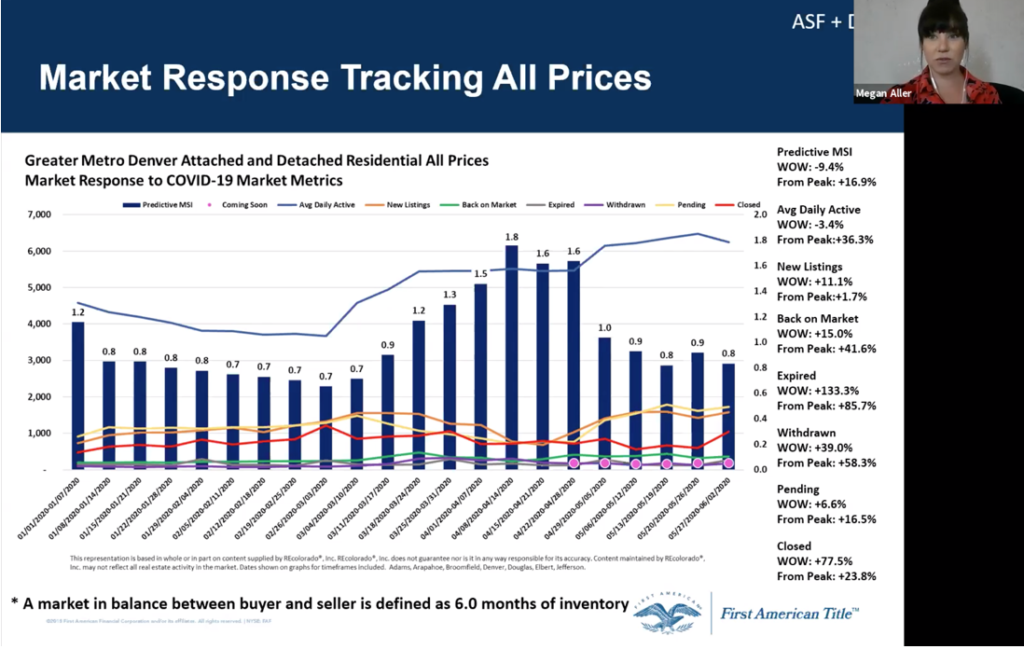
I have better sources for my data and I’m on the front lines and I can tell you our real estate market has come back really strong since “Stay at Home”. The graph below shows data from the beginning of the year. Covid19 really started to impact our market mid-March and the worst of it was mid-April. As you can see, by the first week in May we got back on track and closing just started bouncing back last week. That makes sense right? Homes close 30 days after the showing is completed and the contract is signed. Showings started at the beginning of May, so we would expect closing to follow 30 days later at the beginning of June. Understanding that our data is always lagging by 30 days will really help you navigate real estate stats or you are welcome to JUST ASK ME!


Posted in: Blog, Housing Market Update

What you need to know about Virtual Tours.

5280 posted an article last week “Taking Your House Hunt Online? Here’s What You Need To Know About Virtual Tours” Here are some takeaways to remember about your virtual house hunting.

The article can be found here.

Posted in: Blog, Housing Market Update

July Market Report

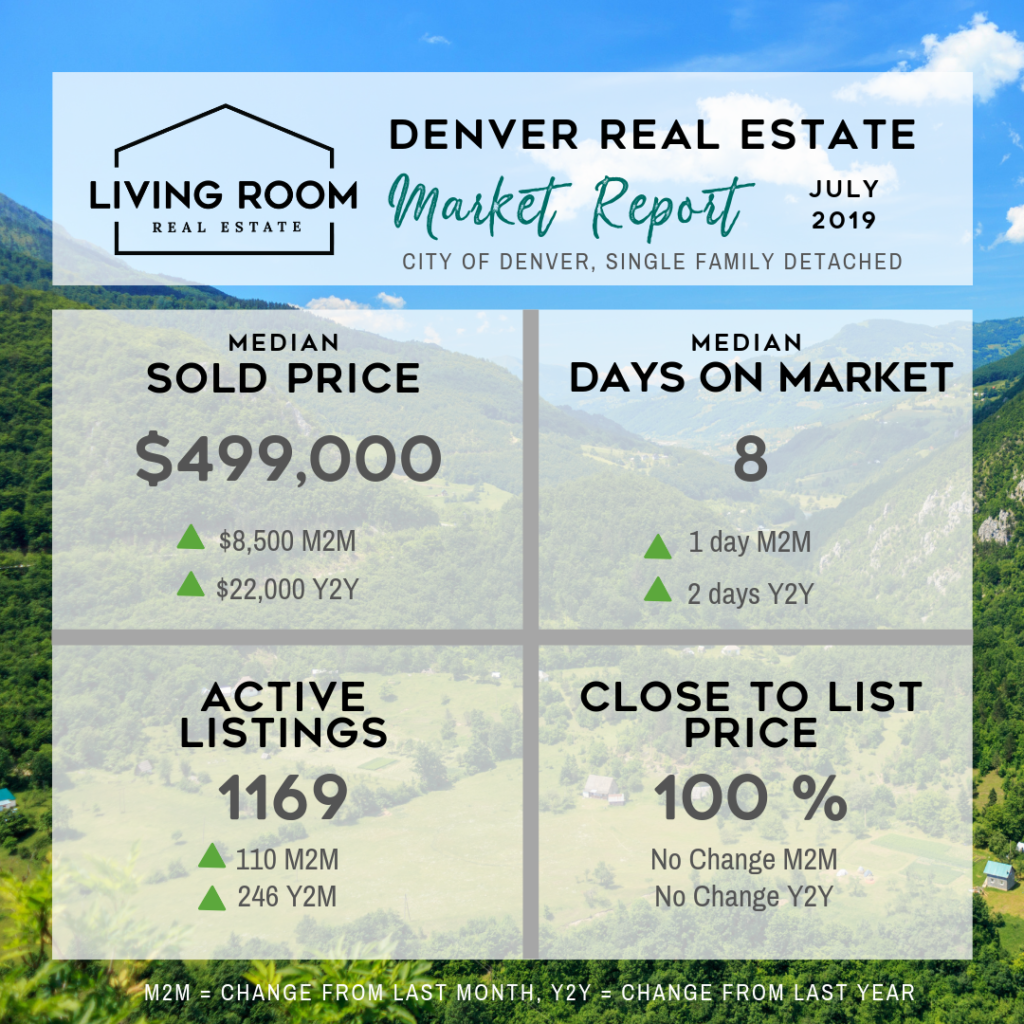
July Market Report was posted. Looking good Denver.

Posted in: Housing Market Update

2018 Real Estate Market Update

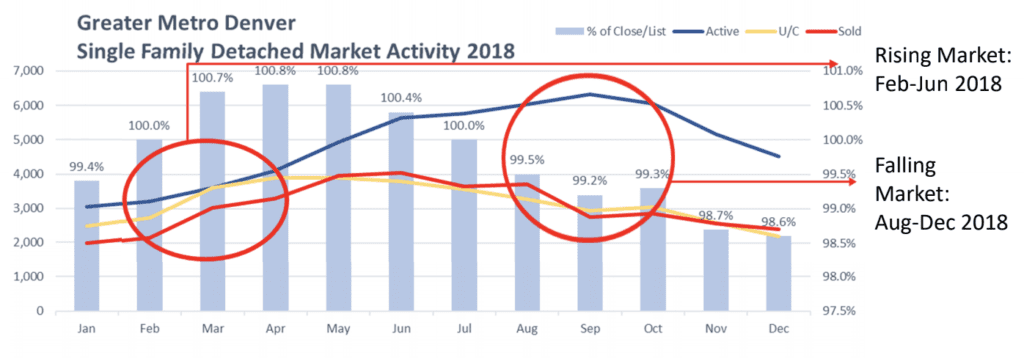
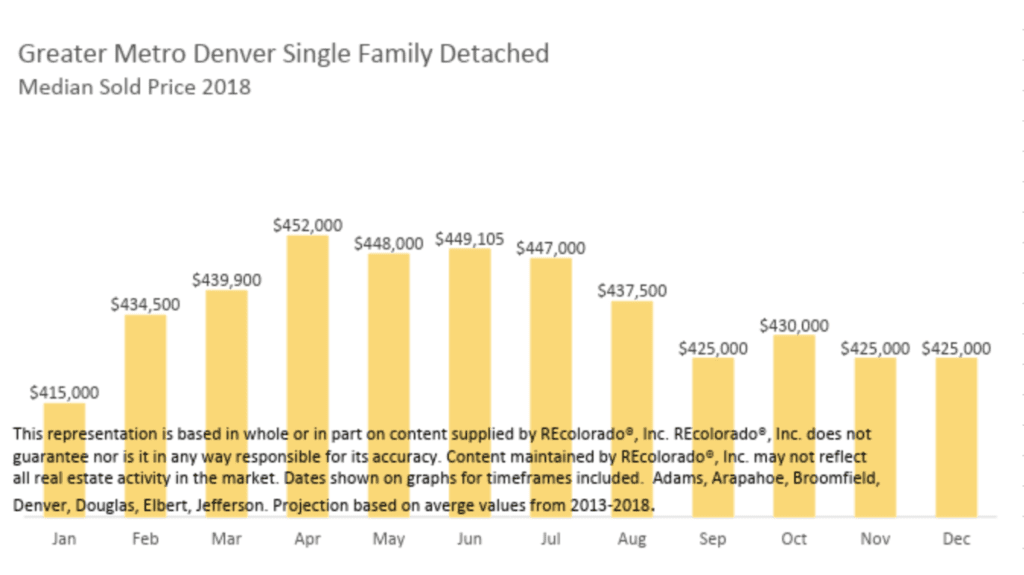
In 2018 we saw the same pattern of the past with a very hot spring market that cooled down when inventory came on in June. September was an unusually slow month due to the midterm elections. The blue columns behind show the percentage of ask price. At the first circle where demand and supply are very tight, you can see that sellers were getting over their asking price. As inventory increased, many listings were going under asking in the Fall.

We definitely saw prices go up in the first half of the year as the Spring bidding wars escalated prices. The highest prices were in April, which would have been clients shopping for homes in March when you see the under contracts peak in the first graph. Although prices dropped after June, they didn’t dip under $415K where we started the year in 2018.

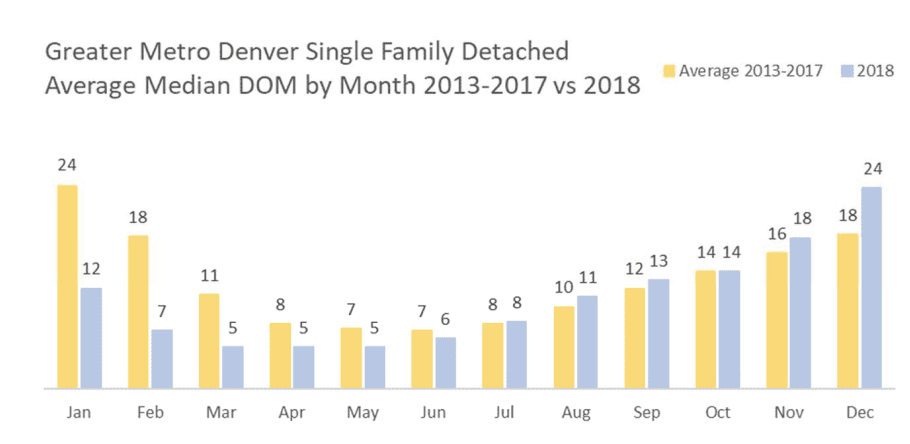
In 2018, listing went under contract faster than average in the beginning of the year, but at the end of 2018 homes actually stayed on the market longer than average between 2013-2017. You can see that in March, April, and May homes were only on the market for about five days. That means they get listed on Thursday, have an open house on Saturday, and are under contract by Monday. This is a very typical pattern for Denver during the Spring market.

Posted in: Blog, Housing Market Update

Blog

SITE NAVIGATION

  • About Living Room
  • Buy
  • Sell
  • Blog
  • ADUs
  • Giving Back
  • Contact Us

Featured Properties

3832 N Cook Street $400,000

3832 N Cook Street Denver, Colorado

2 Beds 2 Baths 1,159 Sq Ft 0.140 Acres

Sale Type: Active Listing courtesy of Porchlight RE Group-Boulder

2700 W Bates Avenue $419,000

2700 W Bates Avenue Denver, Colorado

3 Beds 2 Baths 1,529 Sq Ft 0.140 Acres

Sale Type: Active Listing courtesy of Brokers Guild Homes

4095 Harlan Street $425,000

4095 Harlan Street Wheat Ridge, Colorado

3 Beds 2 Baths 1,991 Sq Ft 0.180 Acres

Sale Type: Active Listing courtesy of MB HAYWOOD & ASSOCIATES

535 S Pecos Street $449,000

535 S Pecos Street Denver, Colorado

3 Beds 2 Baths 1,258 Sq Ft 0.180 Acres

Sale Type: Active Listing courtesy of MB CITYSCAPE REAL ESTATE LLC

167 Lowell Boulevard $449,000

167 Lowell Boulevard Denver, Colorado

3 Beds 2 Baths 1,869 Sq Ft 0.140 Acres

Sale Type: Active Listing courtesy of LIVE URBAN REAL ESTATE

1621 S King Street $450,000

1621 S King Street Denver, Colorado

6 Beds 2 Baths 1,994 Sq Ft 0.140 Acres

Sale Type: Active Listing courtesy of Flat Rate Realty Group LLC

1180 S Zuni Street $450,000

1180 S Zuni Street Denver, Colorado

4 Beds 2 Baths 1,894 Sq Ft 0.150 Acres

Sale Type: Active Listing courtesy of Kentwood Real Estate Cherry Creek

5535 Tejon Street $450,000

5535 Tejon Street Denver, Colorado

4 Beds 2 Baths 1,200 Sq Ft 0.210 Acres

Sale Type: Active Listing courtesy of Littleton Real Estate Company

167 Vrain Street $470,000

167 Vrain Street Denver, Colorado

4 Beds 2 Baths 1,639 Sq Ft 0.160 Acres

Sale Type: Active Listing courtesy of The Gala Realty Group Llc

3580 Hudson Street $475,000

3580 Hudson Street Denver, Colorado

3 Beds 2 Baths 2,184 Sq Ft 0.140 Acres

Sale Type: Active Listing courtesy of MB SUMMERS REALTY

665 S Bryant Street $475,000

665 S Bryant Street Denver, Colorado

4 Beds 2 Baths 1,590 Sq Ft 0.170 Acres

Sale Type: Active Listing courtesy of West and Main Homes Inc

6175 W Arizona Avenue $475,000

6175 W Arizona Avenue Lakewood, Colorado

4 Beds 2 Baths 2,184 Sq Ft 0.150 Acres

Sale Type: Active Listing courtesy of HomeSmart Realty

610 W Lowell $479,000

610 W Lowell Denver, Colorado

4 Beds 3 Baths 2,037 Sq Ft 0.110 Acres

Sale Type: Active Listing courtesy of John Hernandez Realty

1840 W Center Avenue $479,900

1840 W Center Avenue Denver, Colorado

4 Beds 2 Baths 2,588 Sq Ft 0.170 Acres

Sale Type: Active Listing courtesy of Colorado Home Realty

2154 S Fenton Street $498,850

2154 S Fenton Street Denver, Colorado

4 Beds 2 Baths 2,463 Sq Ft 0.160 Acres

Sale Type: Active Listing courtesy of RE/MAX Masters Millennium

1562 Chase Street $510,000

1562 Chase Street Lakewood, Colorado

4 Beds 2 Baths 1,400 Sq Ft 0.120 Acres

Sale Type: Active Listing courtesy of The Gala Realty Group Llc

3601 E Florida Avenue $525,000

3601 E Florida Avenue Denver, Colorado

4 Beds 2 Baths 1,726 Sq Ft 0.140 Acres

Sale Type: Active Listing courtesy of HOME LOGIC REALTY

5312 Lowell Boulevard $545,000

5312 Lowell Boulevard Denver, Colorado

4 Beds 3 Baths 2,116 Sq Ft 0.290 Acres

Sale Type: Active Listing courtesy of Investors Realty LLC

3227 N Fillmore Street $549,900

3227 N Fillmore Street Denver, Colorado

3 Beds 2 Baths 1,598 Sq Ft 0.110 Acres

Sale Type: Active Listing courtesy of RE/MAX ALLIANCE

322 Raleigh Street $549,900

322 Raleigh Street Denver, Colorado

4 Beds 2 Baths 1,646 Sq Ft 0.160 Acres

Sale Type: Active Listing courtesy of LIV Sotheby's International Realty

4221 Navajo Street $550,000

4221 Navajo Street Denver, Colorado

2 Beds 2 Baths 1,039 Sq Ft 0.150 Acres

Sale Type: Active Listing courtesy of Compass - Denver

4259 Perry Street $550,000

4259 Perry Street Denver, Colorado

5 Beds 2 Baths 3,020 Sq Ft 0.150 Acres

Sale Type: Active Listing courtesy of RE/MAX ALLIANCE

1034 Mariposa Street $560,000

1034 Mariposa Street Denver, Colorado

3 Beds 2 Baths 1,353 Sq Ft 0.110 Acres

Sale Type: Active Listing courtesy of TRELORA Colorado

2478 S High Street $565,000

2478 S High Street Denver, Colorado

4 Beds 2 Baths 2,190 Sq Ft 0.140 Acres

Sale Type: Active Listing courtesy of Equity Colorado Real Estate

823 Poplar Street $569,950

823 Poplar Street Denver, Colorado

3 Beds 2 Baths 1,590 Sq Ft 0.140 Acres

Sale Type: Active Listing courtesy of HomeSmart Realty

205 S Fenton Street $570,000

205 S Fenton Street Lakewood, Colorado

5 Beds 2 Baths 2,679 Sq Ft 0.280 Acres

Sale Type: Active Listing courtesy of Coldwell Banker Realty 18

5985 W 37th Place $575,000

5985 W 37th Place Wheat Ridge, Colorado

3 Beds 3 Baths 1,679 Sq Ft 0.150 Acres

Sale Type: Active Listing courtesy of HomeSmart

3501 W 53rd Avenue $575,000

3501 W 53rd Avenue Denver, Colorado

4 Beds 2 Baths 2,599 Sq Ft 0.170 Acres

Sale Type: Active Listing courtesy of Coldwell Banker Mountain Properties

3358 N Saint Paul Street $575,000

3358 N Saint Paul Street Denver, Colorado

3 Beds 3 Baths 2,076 Sq Ft 0.120 Acres

Sale Type: Active Listing courtesy of Keller Williams Integrity Real Estate LLC

2040 Niagara Street $575,000

2040 Niagara Street Denver, Colorado

3 Beds 2 Baths 1,207 Sq Ft 0.150 Acres

Sale Type: Active Listing courtesy of Coldwell Banker Realty

5431 Zuni Street $575,000

5431 Zuni Street Denver, Colorado

5 Beds 3 Baths 2,348 Sq Ft 0.220 Acres

Sale Type: Active Listing courtesy of Denver Realty Group

2886 S Fox Court $575,000

2886 S Fox Court Englewood, Colorado

3 Beds 3 Baths 2,420 Sq Ft 0.050 Acres

Sale Type: Active Listing courtesy of Compass - Denver

871 S Sherman Street $575,000

871 S Sherman Street Denver, Colorado

3 Beds 2 Baths 1,746 Sq Ft 0.110 Acres

Sale Type: Active Listing courtesy of Altitude Real Estate Services, LLC

2443 S Williams Street $589,000

2443 S Williams Street Denver, Colorado

3 Beds 2 Baths 1,326 Sq Ft 0.060 Acres

Sale Type: Active Listing courtesy of Feder Commercial Realty Advisors LLC

4655 Osceola Street $598,000

4655 Osceola Street Denver, Colorado

3 Beds 2 Baths 1,454 Sq Ft 0.140 Acres

Sale Type: Active Listing courtesy of DELUX TEAM REALTY INC

3017 N Steele Street $598,000

3017 N Steele Street Denver, Colorado

3 Beds 2 Baths 1,365 Sq Ft 0.170 Acres

Sale Type: Active Listing courtesy of Keller Williams Advantage Realty LLC

6300 W 1st Avenue $599,000

6300 W 1st Avenue Lakewood, Colorado

3 Beds 2 Baths 2,215 Sq Ft 0.330 Acres

Sale Type: Active Listing courtesy of Keller Williams DTC

3080 Leyden Street $599,900

3080 Leyden Street Denver, Colorado

6 Beds 2 Baths 2,110 Sq Ft 0.150 Acres

Sale Type: Active Listing courtesy of RE/MAX ALLIANCE

3101 Sheridan Boulevard $600,000

3101 Sheridan Boulevard Wheat Ridge, Colorado

3 Beds 2 Baths 2,044 Sq Ft 0.140 Acres

Sale Type: Active Listing courtesy of HomeSmart Realty

2547 River Drive $600,000

2547 River Drive Denver, Colorado

4 Beds 2 Baths 1,218 Sq Ft 0.090 Acres

Sale Type: Active Listing courtesy of 8z Real Estate

3733 N Jason Street $610,000

3733 N Jason Street Denver, Colorado

3 Beds 2 Baths 1,131 Sq Ft 0.070 Acres

Sale Type: Active Listing courtesy of ROCKY MOUNTAIN REAL ESTATE INC

2819 N Jackson Street $615,900

2819 N Jackson Street Denver, Colorado

3 Beds 3 Baths 1,670 Sq Ft 0.050 Acres

Sale Type: Active Listing courtesy of PARAGON REALTY SALES LLC

3295 Meade Street $624,500

3295 Meade Street Denver, Colorado

3 Beds 3 Baths 2,700 Sq Ft 0.100 Acres

Sale Type: Active Listing courtesy of Savvy Realty

3333 E Florida Avenue 93 $625,000

3333 E Florida Avenue 93 Denver, Colorado

3 Beds 3 Baths 3,009 Sq Ft 0.140 Acres

Sale Type: Active Listing courtesy of Thrive Real Estate Group

2784 W 41st $645,000

2784 W 41st Denver, Colorado

3 Beds 2 Baths 1,315 Sq Ft 0.140 Acres

Sale Type: Active Listing courtesy of HomeSmart Realty

1335 S Pearl Street $650,000

1335 S Pearl Street Denver, Colorado

3 Beds 2 Baths 1,588 Sq Ft 0.090 Acres

Sale Type: Active Listing courtesy of Colorado Home Realty

275 S Lafayette Street $650,000

275 S Lafayette Street Denver, Colorado

2 Beds 2 Baths 1,092 Sq Ft 0.110 Acres

Sale Type: Active Listing courtesy of RE/MAX Cherry Creek

365 S Forest Street $650,000

365 S Forest Street Denver, Colorado

5 Beds 2 Baths 2,335 Sq Ft 0.160 Acres

Sale Type: Active Listing courtesy of HomeSmart

$660,000

Other,

3 Beds 2 Baths 2,028 Sq Ft 0.100 Acres

Sale Type: Active Listing courtesy of Snyder Realty Team

2917 Grape Street $669,900

2917 Grape Street Denver, Colorado

3 Beds 3 Baths 1,731 Sq Ft 0.160 Acres

Sale Type: Active Listing courtesy of MB SOUTHWEST SABINA & COMPANY

Property Search

Advanced Search Map Search

Recent Comments

    BLOG NAVIGATION

    • ADU
    • Denver News & Community Updates
    • Homeowner Tips
    • Housing Market Update
    • Insider Information
    • Listings with Living Room
    • Our Clients

    Our Latest Listing Video

    https://livingroomdenver.com/wp-content/uploads/2020/11/325-e-18th.mp4

    Our Mission

    We pair people with the right place for a prosperous life.

    Contact Us

    4045 N Pecos St, Denver, CO 80211
    303-720-8491
    © 2021 · Equity Framework
    Privacy Policy · Listings Sitemap · Log in