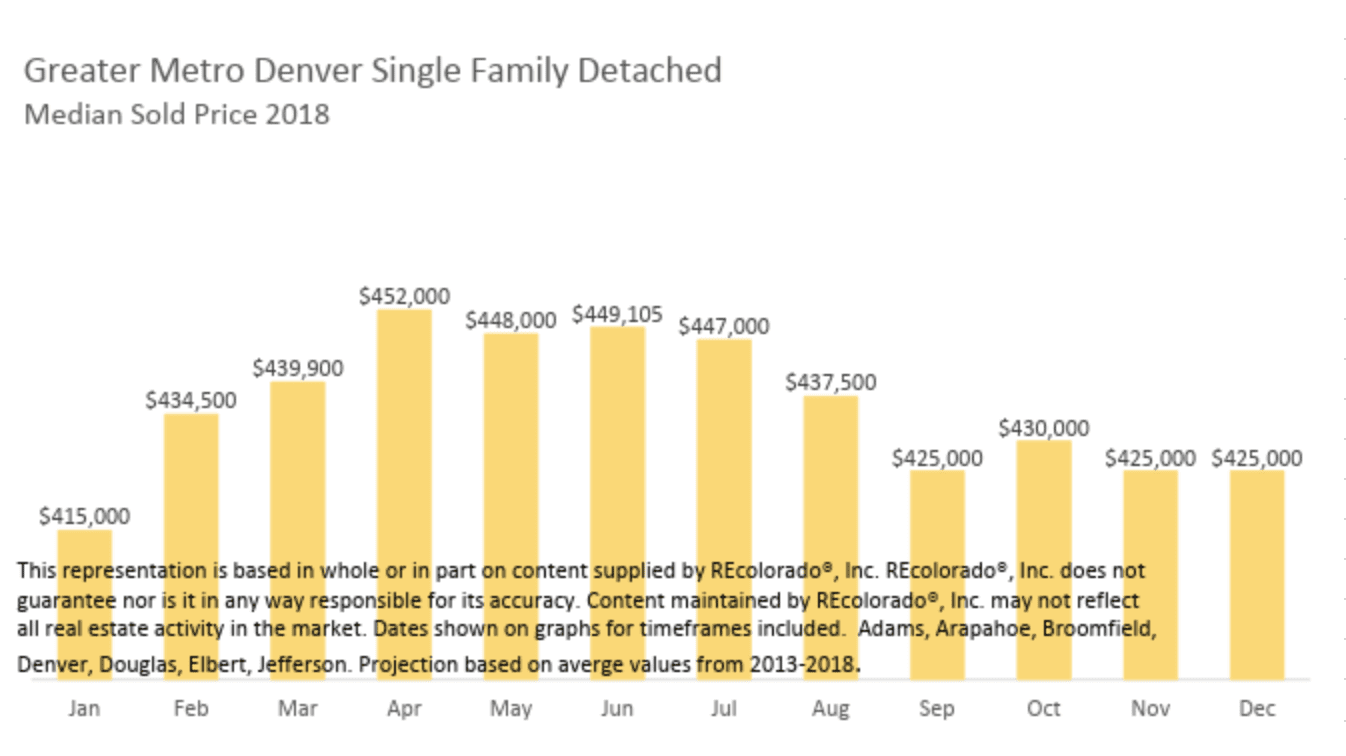
We definitely saw prices go up in the first half of the year as the Spring bidding wars escalated prices. The highest prices were in April, which would have been clients shopping for homes in March when you see the under contracts peak in the first graph. Although prices dropped after June, they didn’t dip under $415K where we started the year in 2018.
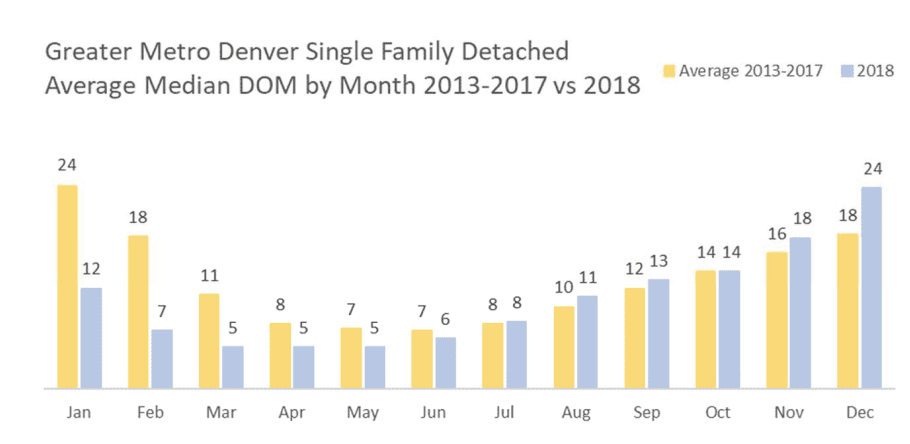
In 2018, listing went under contract faster than average in the beginning of the year, but at the end of 2018 homes actually stayed on the market longer than average between 2013-2017. You can see that in March, April, and May homes were only on the market for about five days. That means they get listed on Thursday, have an open house on Saturday, and are under contract by Monday. This is a very typical pattern for Denver during the Spring market.